
February 02, 2015
Making data driven decisions is key to driving growth in your mobile app, and it’s the reason that nearly every app developer in the world integrates analytics tracking within their app. In fact, in a recent Tapdaq survey we discovered that 90% of developers have implemented a third party analytics SDK into their app[bctt tweet=”90% of developers have implemented a third party analytics SDK into their app” username=”DevEconomics”].


However, we were surprised to then learn that only 5% of these developers knew what to do with the data points which they were tracking. After speaking with a large group of the developers questioned, we realised that many aren’t sure which metrics are most important, or what steps they need to take in order to improve.
As the App Store has matured, creating a chart-topping product has become a much more complex process. App analytics providers have moved with the times and now provide developers with more data than ever before on their app’s performance. In this post I am going to pick out 12 app metrics and explain why they are the most important data points when tracking your app’s success.
Acquisition
Growth of your app business starts at the user acquisition stage. Here there are several key questions which all developers ask themselves.
How many installs have I generated?
Tracking installs received as an overall figure is very easy, and all data is provided through iTunes Connect/Google Play.
How much have these downloads cost?
You have to know what your cost per install (CPI) is when paying to acquire new users to your app. [tweetable]If your CPI rises above the value of your user’s lifetime value (LTV), then the campaign is unprofitable[/tweetable] and unless you are propped up by strong organic install numbers, your business is going to struggle.
Working out your cost per install on mobile ad networks is straightforward, and nearly all networks now give this figure to you up front. If you are acquiring users via cost per install ad networks then I’d recommend you test multiple platforms, providing you have a large enough budget. In an interview with KISS Metrics, Wooga’s head of marketing, Eric Seufert, said the company used 23 ad networks to get their Jelly Splash game in to the top charts of the key markets.
Where did these downloads come from?
When you see a spike in your app’s downloads, the first thing you want to know is where they came from. By using install attribution tools you can see a breakdown of all your installs by referral source, which gives you far stronger idea of which networks can send you the greatest volume of users for the lowest cost.
How high a quality are the users within my app?
This question can’t be answered immediately, but, over time, [tweetable]cohort analysis can help you to get a better understanding of the quality of the users [/tweetable]within your app. Specifically, when working with multiple paid traffic sources, you can work out which platform provides you with the most real value beyond just the install itself.
For example, Ad Network A might have sent you 10,000 installs for $20,000, whereas Ad Network B sent 10,000 installs for $15,000. If looking at the CPI alone, logic would say that Ad Network B is the preferred choice here. However, using cohort analysis you may discover the users from Ad Network A have an LTV of $2.50, whereas the users from Ad Network B only have an LTV of $1.50. So, in terms of real value, Ad Network A would actually be the optimal solution.
Engagement
In mobile analytics, the fun really starts after the install. With app engagement there are multiple metrics that need to be tracked in order to paint a picture of how engaged your users really are.
Session Length
Tracking your session length is not as straight forward as it sounds. Different analytics companies have different definitions when it comes to sessions. For example, Flurry deem a session to start when an application is opened, and end when the app is terminated. By default, a session is ped as terminated if a user leaves the app for more than 10 seconds, although this logic can be changed.
In contrast, Google Analytics only consider a session to be over after 30 seconds of inactivity, although again this can be customised to any required time.
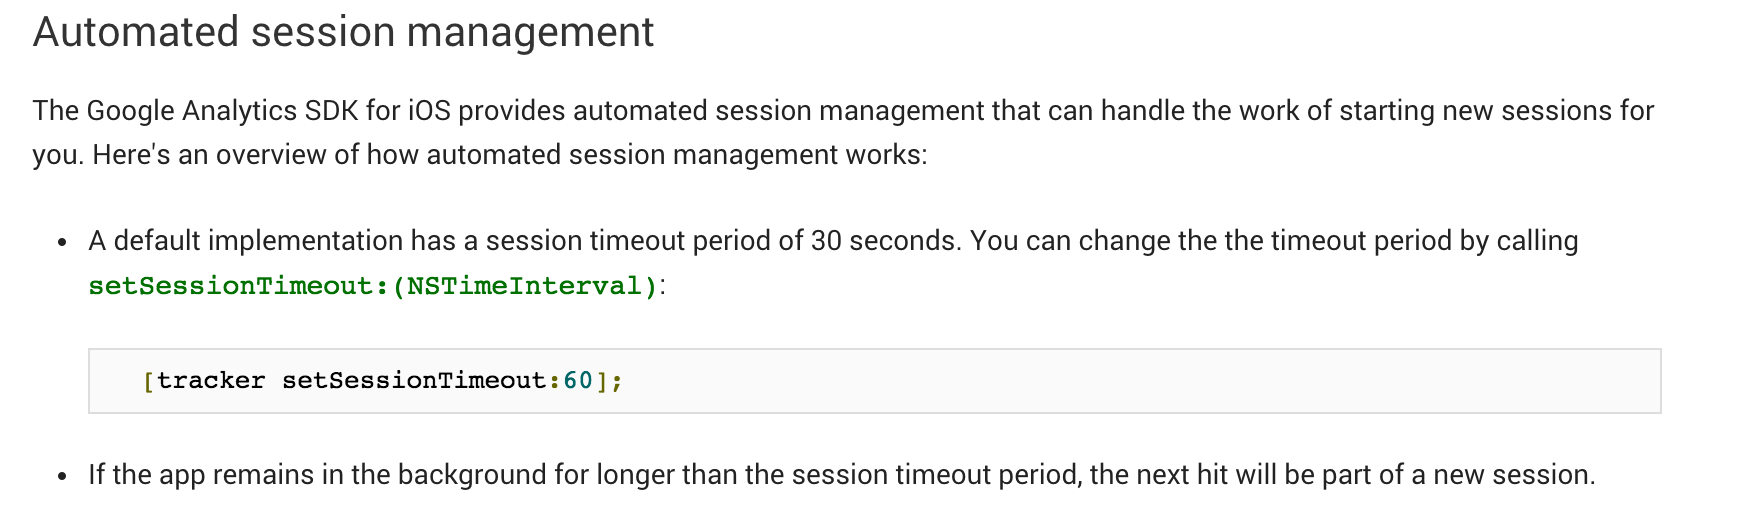
They key takeaway here is to ensure you know exactly how a session is defined within your app, as the definition does vary depending on who your analytics provider is.
Time in App
This is a marketing metric that is sometimes confused with session length, and is also often classed as a retention metric.
Where session length describes how long a user’s individual session lasts, time in app is used to define how long a user spends within an app, in total, over a given length of time. For example, a user could spend 2 hours in an app over the course of a week, and this could comprise of multiple sessions. The more time a user spends in your app on a daily basis, the better your chances are of monetising that user.
Popular Pages/Features
Understanding which pages and events are most popular in your app helps you paint a better picture of which content is most valuable to your users. More importantly, it also highlights weaknesses too. By tracking your page visits and conversion funnels you are able to see exactly where users drop out from your app, and this enables you to make data driven decisions on what content to improve in order to get more users reaching the ‘aha’ moment in your product.
Retention
It is argued that user retention is what sets apart a top grossing app from its competitors. Whilst user engagement tracks how long users spend within your app, user retention focusses on how often customers visit your app. It’s worth bearing in mind that a digital product can be a huge success, even if engagement is low, providing retention rates are high. For example, Google is a very successful tech company with sky high retention rates, yet engagement is relatively low.
Let’s take a look at the most important engagement rates you need to be tracking…
Retention Rate
User retention rate can be calculated in a number of ways. However, probably the most popular method is rolling retention (which is actually the default method used by Flurry Analytics).
To calculate this, you need to look at the proportion of users returning to your app on Day+N, or any day after that, and dividing it by the number of users who had installed your app on Day 0.
Here’s a great graphic from the Applift blog that summarises this calculation…


It’s going to be very interesting to see exactly how powerful Apple make their analytics tracking within iTunes Connect. A sneak preview has been posted on the AppTweak blog, showing a screenshot of a cohort table used for tracking retention…

Daily and Monthly Active Users
[tweetable]Your daily and monthly active user count is another measure of just how ‘sticky’ your app is[/tweetable]. Over time, successful apps look to grow the gap between their daily downloads and their daily active users, and they do this by ensuring they add as much value to their customers as often as possible.
Again, both these metrics are heavily tied with engagement. The more engaging the content is within your app, the more likely it is you will retain your users. The more often you can provide them with value, the higher your DAU count will be.
Churn rate
User churn rate is a key metric to understand, particularly when you come to calculating your user lifetime value (LTV). Churn rate is the opposite to retention rate and is the measure of how many users stop using your app over a given period of time, usually a month.
Churn rate is expressed as a percentage of the number of people who could have left and it is not possible for customer churn to be 0% or lower. An example would be: If your app has 100 users, then 100 people could leave/stop using your app this month. At the end of the month, only 23 users stop using your app, so this means you have a churn rate of 23%.
Monetisation
Average Revenue Per User (ARPU)
This metric is often confused with LTV, but it’s actually a far simpler data point to track. ARPU is the revenue you generate, on average, from each user of your application, and this can be calculated by simply adding up the revenue your app generates each month, and dividing it by your total number of users.
LTV
Lifetime Value, often shortened to LTV, is the measure of the revenue a customer will bring during their lifetime of using your application. In our recent Tapdaq survey, amazingly all 60 of the developers we spoke to said it was the most valuable metric in app marketing.
To calculate the LTV of one of your users there are several data points you need to know. They are:
- Customer Churn: As described above…
- Income: This includes all revenue from In-App Purchases and subscriptions, after Apple has taken their 30% cut, and any income from selling advertising space within your applications.
- Number of active users: This one’s fairly obvious, it’s the number of active users your application has. The definition of what a “user” or “active user” is will vary depending on your application and your business model. If you have a mix of active users where some generate income and some don’t, include them all. This mix will likely continue as your app grows.
- Average Revenue Per User (ARPU): As described above…
Once you have collated all the numbers above, just plug them into the equation below to discover the average LTV of your users.

App Success Sum Up
There are quite a number of important metrics that you need to be tracking and improving upon in order to make your app a true success. Always be looking at the wider picture, and evaluating how each metric has an effect on one another. If your team is small, or you are an indie developer working alone, then I’d recommend starting by iterating your product with the focus on increasing engagement, retention, and your average user LTV. You don’t need to have millions of users on board in order to build a truly great mobile app. Test heavily, and make data driven decisions in order to position yourself in a place where you can start to invest in acquisition with the confidence in your product’s quality and monetisation.


Contact us
Swan Buildings (1st floor)20 Swan StreetManchester, M4 5JW+441612400603community@developernation.net


